Knowledge and Skills Statement
The further explanation is designed to be a resource for educators that helps them better understand the topic their students are learning. Further explanations may be written at a more complex level than would be expected for students at the grade level.
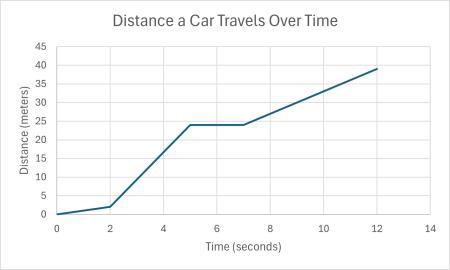
A distance-time graph indicates the distance an object moves in the corresponding amount of time. An object that is not moving will have no change in distance, shown as a horizontal line on the graph. The speed of the object during any segment of the line can be calculated by dividing the change in distance by the change in time.

This distance-time graph shows the object moving at a speed of 1 m/s from 0 to 2 seconds, a speed of 8 m/s from 2 to 5 seconds, stopped from 5 to 7 seconds, and then moving at a speed of 3 m/s from 7 to 12 seconds.
Research
Galluzzo, Benjamin, Michael Ramsdell, Joshua Thomas, Kathleen Kavanagh, Cory Ryder, Darlene Bissonette, and Jennifer Knack. "Cornhole Predicts the Perfect Pitch: A Hands-On Projectile Motion Experience Comparing Models and Data." Science Scope 44, no.5 (2021): 54–60. DOI:10.1080/08872376.2021.12291415
Summary: In this article, students use the game of Cornhole, where bean bags are tossed into holes on a board, to practice data collection and analysis and make mathematical calculations. Students make predictions on launch speeds and angles to help them play more effectively and score more points. The activity starts with a computer game that simulates the game of Cornhole to brainstorm ideas using factors present during the game. Students then used an interactive mathematical spreadsheet for data collection. This activity allows students to use mathematical calculations to make predictions and explore cause-and-effect relationships.
