Knowledge and Skills Statement
In a science notebook, have students construct a chart and collect weather data over a given period. The chart should include temperature and precipitation, and weather conditions from previous grades, such as cloud cover and wind speeds, could also be included. Have students graph the temperature, precipitation, and other factors over time using bar graphs or pictographs and describe the patterns they see. Depending on where students live, they may notice that April and May tend to have more precipitation while September tends to be a drier month. Or they may notice that temperatures tend to be hotter in September than they are in January.
Student graphs should include a title and a label for the vertical and horizontal axes. Grade 2 students are not expected to use the terms x and y axis. Instead, students and teachers may refer to the vertical and horizontal axes. For example, students might draw a bar graph titled "Weekly precipitation in January." Along the vertical axis, they would indicate the amount of precipitation in inches. Along the horizontal axis, they might label their bars as "Week 1", "Week 2", "Week 3", and "Week 4." Regarding cloud cover, students may notice patterns like darker, thicker clouds typically mean there will be precipitation while wispy clouds or large fluffy clouds indicate fair weather.
The further explanation is designed to be a resource for educators that helps them better understand the topic their students are learning. Further explanations may be written at a more complex level than would be expected for students at the grade level.
In grade 1, students described weather conditions, including hot or cold, clear or cloudy, calm or windy, and rainy or icy. In grade 2, it is appropriate for students to measure and record weather data including temperature and precipitation. Student descriptions of clouds are more detailed and should be related to types of weather.
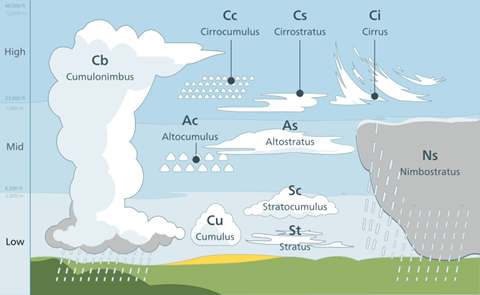
In the picture above, many types of clouds are shown, including combinations of the four main types. The types of clouds most likely to produce rain are also identified. The four types of clouds that students may describe and record are:
Cirrus
Composed of ice crystals, cirrus clouds are whitish and horsetail-like. High, scattered, wispy clouds in a blue sky are associated with fair weather conditions. If they begin clumping together, a storm system is advancing.
Cumulus
Cumulus clouds look like white fluffy cotton balls and are usually dense in appearance with sharp outlines. They show vertical motion when there is thermal uplift of air in the atmosphere. The base of cumulus clouds is generally flat and sits at the altitude where the moisture in rising air condenses. Typically low hanging, fluffy clouds are associated with fair weather conditions.
Stratus
Stratus clouds are usually broad and widespread, like a blanket. They result from rising air that is not circulating and tend to occur along warm fronts. The edges of strato-form clouds are diffuse and fuzzy. Weather related to stratus clouds varies from light rain and drizzle to heavy steady rain.
Nimbus
A special rain cloud category that combines cumulus + cirrus + stratus, nimbus is the Latin word for rain. The vast majority of precipitation occurs from nimbus clouds, and therefore these clouds are generally the thickest. All severe weather is associated with nimbus clouds.
Research
Coskie, Tracy L., and Kimberly J. Davis. “Science Shorts: Organizing Weather Data.” Science and Children 46, no. 5 (2009): 52–54. http://www.jstor.org/stable/43174474.
Summary: In this article, the author provides examples of instructional strategies that can be used to teach students that weather plays a significant role in changing the Earth's surface. Students can see examples of these changes every day. Because these changes often happen very slowly and on a large scale, models allow students to see how these changes take place. Students can start by recording examples of water changes on the earth in their everyday environment. They can take pictures of these examples of illustrating them in their science journals. These examples can be used to generate questions that can be tested. As a class, students can use soil and water to model these processes and find answers to their questions. Students must understand that models have limitations and are different from the natural process of erosion.
Research
Crane, Peter. “On Observing the Weather.” Science and Children, no. 8 (2004):32–36. http://www.jstor.org/stable/43172285.
Summary: Learning about and paying attention to weather patterns can help students understand the natural world and practice gathering data. In the article, a meteorologist explains what a day doing his job looks like and how that can be modified for students in a classroom. He explains that thermometers must be used consistently and out of direct sunlight to get accurate readings. Teachers can have students do their "sky scans" by observing whether it is sunny or cloudy, eventually observing the different types of clouds they see. Students can use school-made tools to measure precipitation and wind speed. Students can take the recorded data and display it in their weather reports. He suggests using a posterboard, displaying it on a website, or even putting it in the school newspaper for other students to read.

