Let's Get Started
TEKS Standards and Student Expectations
A(5) Linear functions, equations, and inequalities. The student applies the mathematical process standards to solve, with and without technology, linear equations and evaluate the reasonableness of their solutions. The student is expected to:
A(5)(A) solve linear equations in one variable, including those for which the application of the distributive property is necessary and for which variables are included on both sides
A(5)(B) solve linear inequalities in one variable, including those for which the application of the distributive property is necessary and for which variables are included on both sides
Resource Objective(s)
Use a variety of methods to solve one and two variable equations and inequalities.
Essential Questions
What steps are required to solve a linear equation or inequality algebraically?
What does the intersection of two linear equations represent on a graph?
How is a linear inequality represented on a graph?
Vocabulary
Solving Verbal Descriptions of Linear Equations
When given a situation, it is first necessary to write an equation. There are two methods that can be used to solve a linear equation.
Example Problem
Lawns Beautiful charged Mrs. Garcia $119 for plants, plus $25 per hour for a landscape designer to complete the landscaping of her yard. The total charge was $253. How long did the designer work to complete the landscaping of Mrs. Garcia's yard?
The first thing that you would do is to write an equation that represents the situation.
- The problem asks to find how long the designer worked to complete the landscaping job. Therefore, x = hours.
- Mrs. Garcia was charged $119 for plants.
- She was also charged $25 per hour. This can be represented with the expression 25x.
- She spent a total of $253.
- The equation that represents this situation is 119 + 25x = 253.
Graphing the Equation
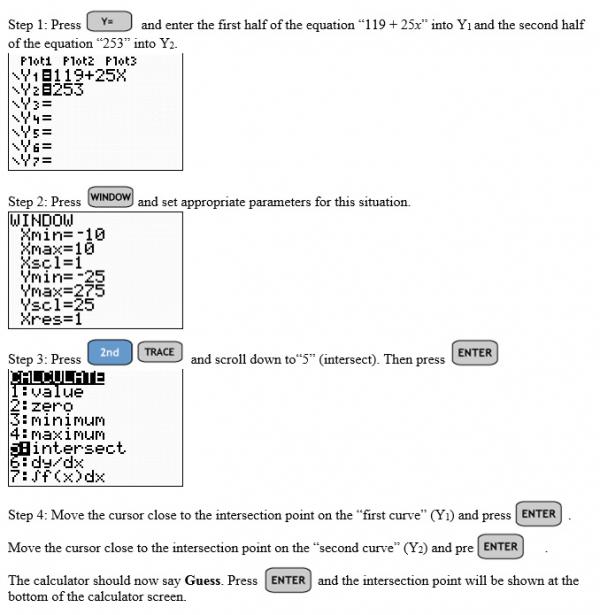
Another way to solve the equation is to graph both sides of the equation and find the intersection.
The intersection point is (5.36, 253). This point represents the x-value, 5.36, which is the total hours, and the y-value, 253, which represents the total amount of money spent.
Use either method to answer the questions in the following quiz to solve the problem.
Two Methods of Solving Linear Equations
When a linear equation has two variables (x, y), the solution is any point that satisfies the equation that lies on the line. There are two methods to determine if a point is a solution to an equation.
For example: Is (-2, 3) a solution to the equation 3x + y = 3?
Method 1: Algebraically
Substitute the given values for x and y into the equation.
3x + y = 3
3(-2) + 3 = 3
-6 + 3 ≠ 3
-3 ≠ 3
Since the equation is false, we know that (-2, 3) is NOT a a solution to the equation.
Method 2: Graphically/Table
Solve the equation in y = form: y = -3x + 3
Enter the equation in "Y1" of your graphing calculator.
The table shows that when x = -2, y = 9, so (-2, 3) is NOT a solution to the equation.
Determine which method you prefer, and complete the problems in the following activity. If you need a graphing calculator, use the Equation Grapher Tool.
To use the Equation Grapher Tool:
- Enter the equation in Y1=.
- Press Graph.
- Check the Function Value table at the right for the given ordered pair.
Missing Pieces of Information
At times, you may be given a partial ordered pair and an equation, and you will be asked to determine the value of the missing variable.
There are two different methods for finding the missing value from an ordered pair from an equation.
Example: If (−1, y) is a solution to the equation 2x – 7y = 40, what is value of y?
Algebraically, you would just need to substitute -1 for x in the equation, and solve for y.
You could also enter the equation (solved for y) into your graphing calculator and look at the generated table of values.
For example, if we look at the equation for the last example (2x – 7y = 40) and rewrite it so that it is solved for y, the equation would be
Enter this into your graphing calculator under "Y1." Look at the TABLE for the y-value when x = -1.
By looking at the table, we can see that when x = -1, y = -6.
Choose a method you prefer to complete the practice problems in the activity below.
Solve Linear Inequalities by Graphing
Watch the following video to learn about solving linear inequalities by graphing. Complete each of the three activities within the video to check your understanding.


