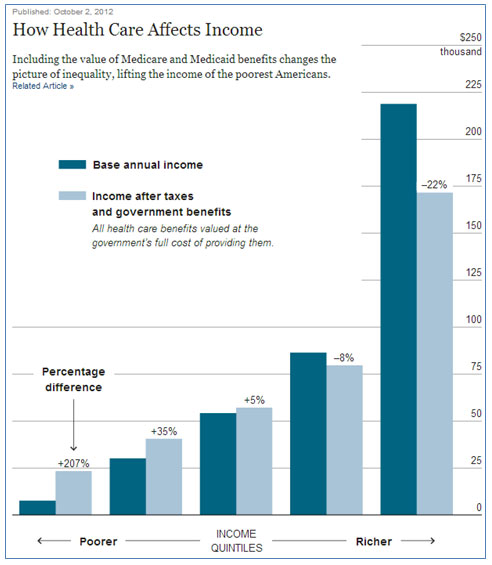
In October 2012, The New York Times published an interactive graph on their website comparing a person’s income before and after considering the person’s taxes and health care benefits. Click on the image to access the article.
Data are frequently displayed in graphs in the media to make it easier to visualize what a set of numbers actually means. Different data displays are used for different purposes.
- Bar graphs are used to display categorical data so that comparisons may be made between the data values from different categories.
- Line graphs are used to show how data change over time.
- Dot plots are used to show the distribution of a set of data and make decisions about the spread or central tendency of the data set.
- Stem and leaf plots are used to show the distribution of numerical data.
- Circle graphs are used to show how parts of a whole compare to one another, usually using percentages of the whole.
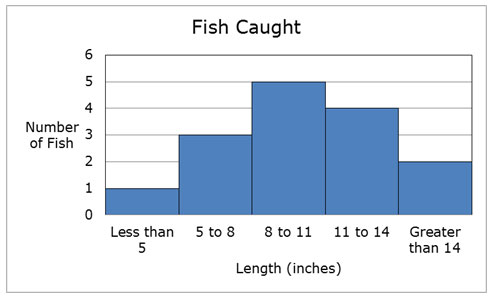
- Histograms are used to show the spread of a set of numerical data using intervals.
- Box and whiskers plots, also called box plots, are used to visually represent five key statistics from a set of data: minimum value, first quartile, median, third quartile, and maximum value.
Data are also used to describe characteristics of a particular population or a group that is being studied. It is usually difficult to survey every member of a population, so frequently a representative sample is used to describe the characteristics of a population. For example, The New York Times reported the following survey that was conducted in 2009. The researchers did not talk to every American resident over the age of 15. Instead, they selected a sample of residents in order to describe the entire population, or all American residents over the age of 15.
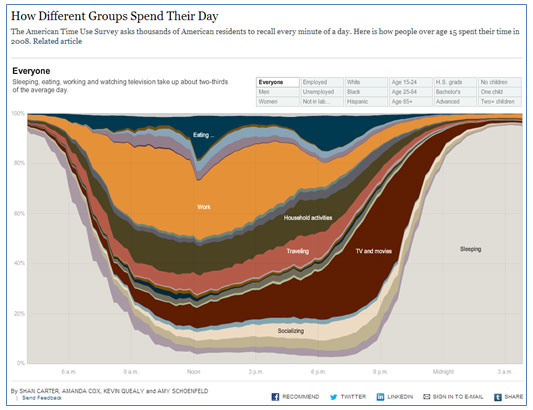
To see the graph as it was in the original interactive, as well as additional graphs from the same survey, click on the above image. (Use Firefox or Internet Explorer as your browser in order to use the interactive.)
In this lesson, you will investigate how a random sample can be used to describe a population. You will also look at different ways that valid conclusions can be drawn from a set of data that is displayed in a visual format such as a table or a graph.
 In this section, you will use sampling techniques in order to describe a neighborhood forest.
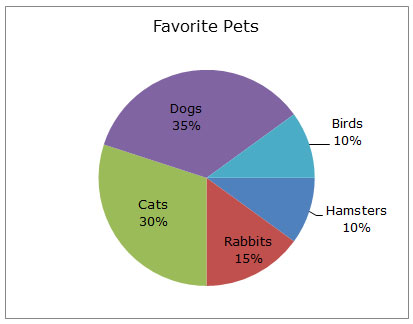
 In the last section, you used data from a sample to make predictions about the population. In this section, you will use the data presented in graphs to determine if particular conclusions can be made.
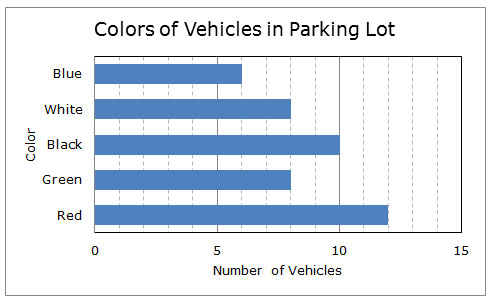
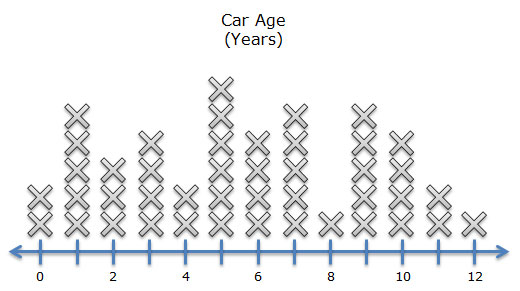
 Jacob thought that Cynthia’s car color study was interesting, so he went into the same row of the teachers’ parking lot to look at the age of each car. Jacob determined the car’s age by subtracting the year the car was made from the current year. He represented his data in the dot plot shown below.